


P&D ANEEL - ENEVA - Forward Curves for Electricity Markets
The objective of the project was to develop a methodology for estimating and forecasting the forward curve of electricity, materialized in a web tool prototype that enables the realization of market price studies and risk analysis. The methodology considered both the context of the weekly PLD (spot price for electricity in Brazil) and the introduction of hourly PLD and its impact on energy trading in Brazil. The developed prototype tool allows electric sector agents not only to perform risk analysis and price forecasting with greater accuracy, but also to negotiate innovative products, helping the Brazilian market to develop.
Team: Marina Dietze, Iago Chávarry, Ana Carolina Freire, Davi Valladão, Alexandre Street, Stein-Erik Fleten
Publications
Scientific article published in IEEE Transactions on Power Systems on the new methodology for calculating the electricity market forward curve:
Marina Dietze, Iago Chávarry, Ana Carolina Freire, Davi Valladão, Alexandre Street, Stein-Erik Fleten, "A Novel Semiparametric Structural Model for Electricity Forward Curves", IEEE Transactions on Power Systems, 2022.
Monteiro, M., Street, A., Chávarry, I., Freire, A. C., Fernandes, C., Valladao, D., & Bodin, G. "Ferramenta computacional para modelagem e previsão probabilística de curvas forward de eletricidade". XXVI SNPTEE, Rio de Janeiro, Maio 2022.
Originality
'The results of this tool can be used by energy traders to price their portfolios and to calculate their buying and selling strategies based on joint probability distributions of all future prices. In addition, contract desks as well as energy exchanges with central counterparties can use the current curve estimation and the historical reconstruction module to calculate margin requirements, control risk exposure, and evaluate low or no-assets.'
Tools
Abaixo seguem algumas telas da ferramenta:
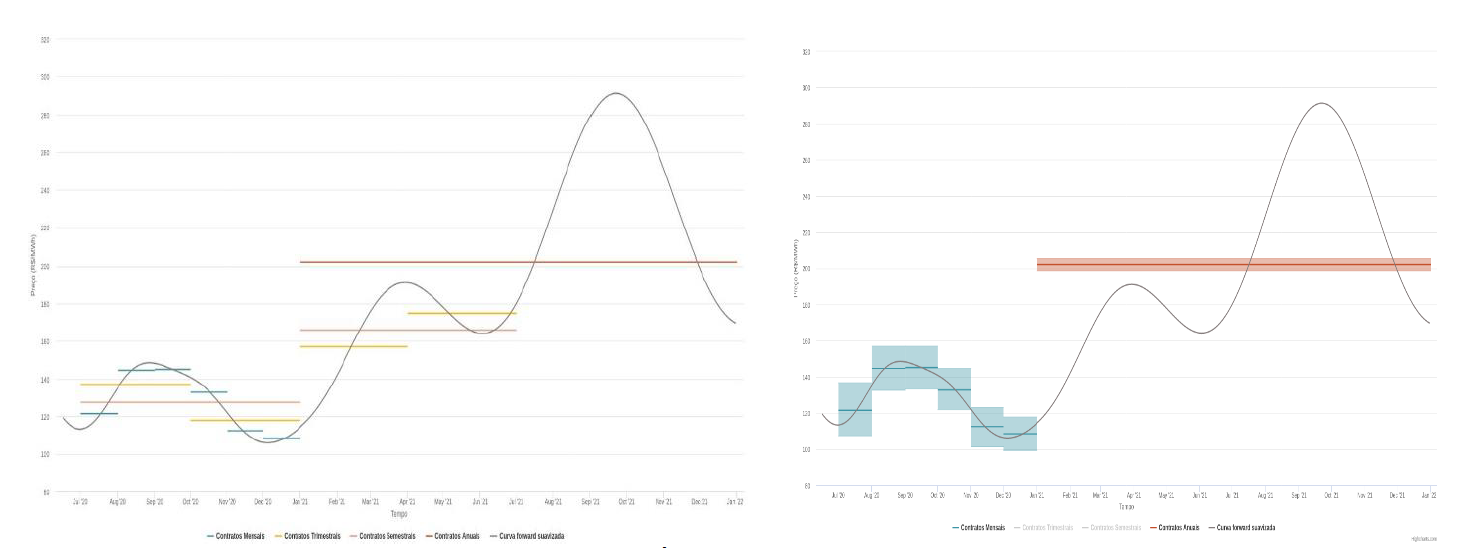
Figura 1 - Forward curve estimates (left) and intervalar estimates (right - probabilistic - 95% interval).
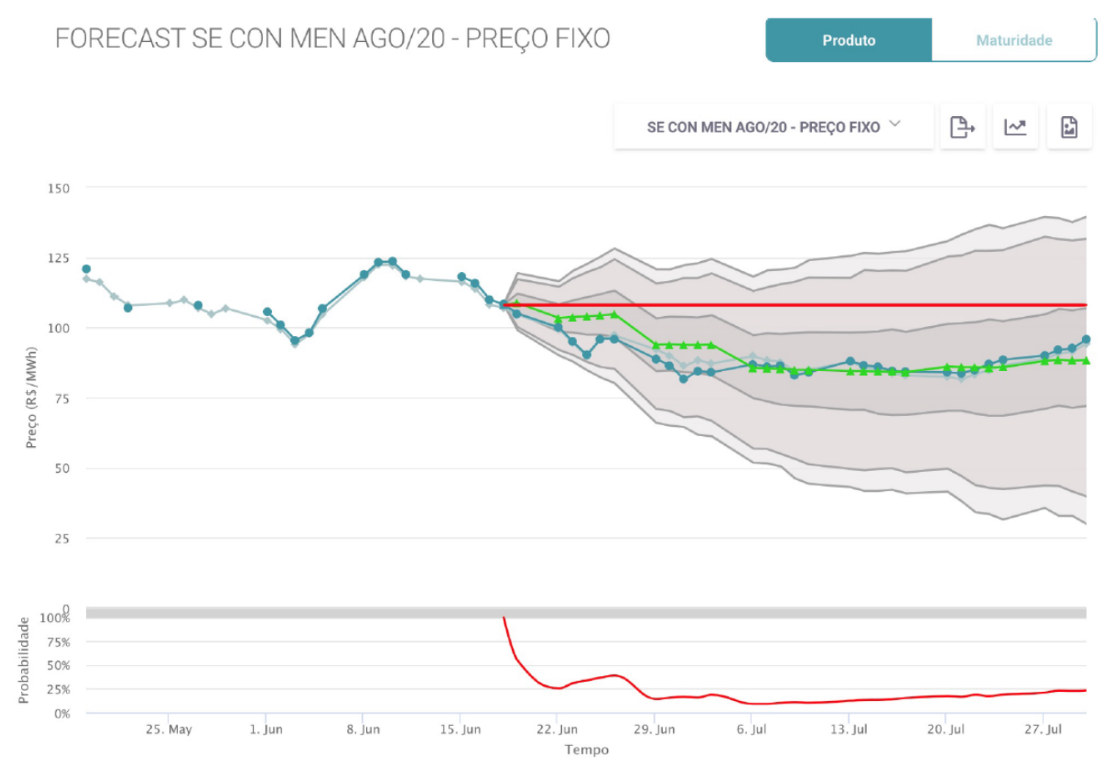
Figura 2 - One-week ahead probabilistic forecast
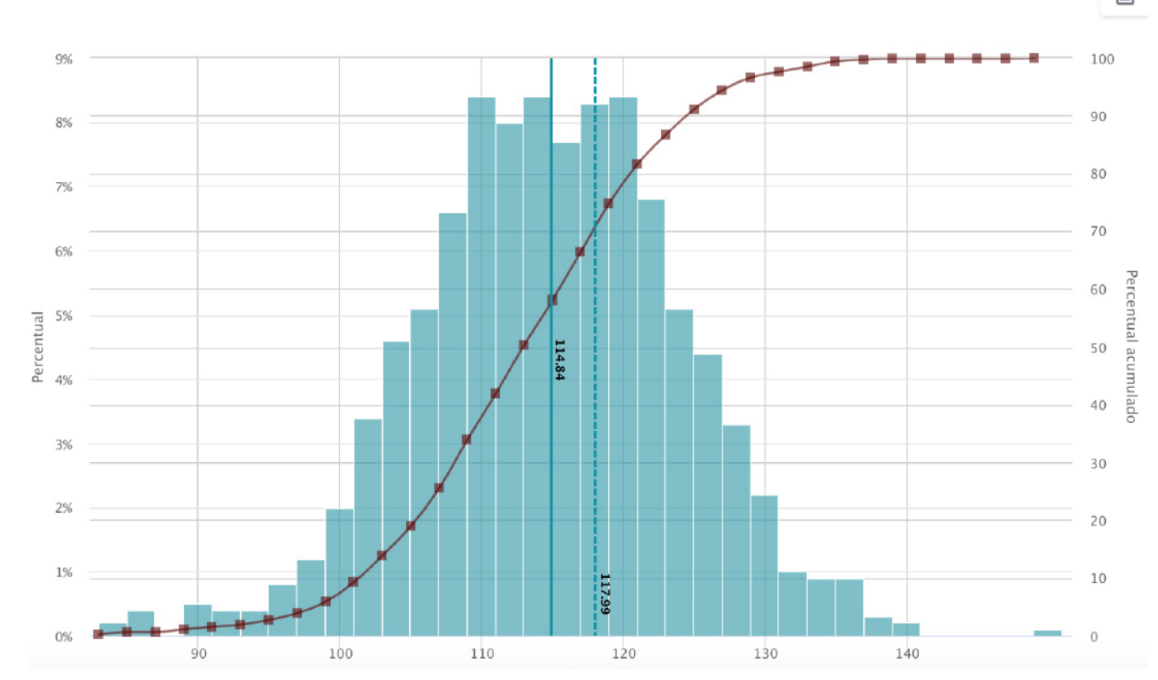
Figura 3 - Forward price distribution.
Events
Several presentations and minicourses were prepared during the R&D project. During the developments, an open webinar with relevant nomes from the Brazilian power sector was also carried out. See the playlist below (some of the videos are only available in Portuguese).